Local Sea-Level Projections
Oceanic processes, gravitational effects and local processes like land subsidence lead to substantial regional differences in sea-level projections. This website allows you to browse through local sea-level projections provided by Kopp et al. (2014), extended by data based on Rasmussen et al. (2018) and Bamber et al. (2019).
You can also select a tide gauge station on the zoomable map below:
At locations where no tide gauge station is available, gridded sea-level projections can be selected (yellow squares). Gridded sea-level projections come with substantially higher uncertainities. Therefore, we strongly recommend to use projections for tide gauge stations whenever possible!
Sea-level projections are presented relative to 2000 for three scenarios leading to different increases in global mean temperature above pre-industrial levels:
- A scenario staying below 2°C of warming at the end of the century without a further temperature increase beyond 2100.
(RCP26) - A scenario reaching a warming of around 2.5°C at the end of the century
(RCP45) - A scenario exceeding a warming of 4°C at the end of the century
(RCP85)
Above scenarios are based on different greenhouse gas emissions from 2006 onwards, clear differences in future sea-level rise, however, only materialise in the second half of the 21st century due to the time-lagged sea-level response to greenhouse gas forcings. For more information on the underlying emission scenarios and the resulting warming trajectories, please see Meinshausen et al. (2011).
A key source of uncertainty in projections of future sea-level rise relates to the contribution of the Antarctic ice sheet. To provide a more comprehensive representation of this component, we also include sea-level projections for selected scenarios with a revised Antarctic ice-sheet contribution based on expert judgement presented in Bamber et al. (2019).
References
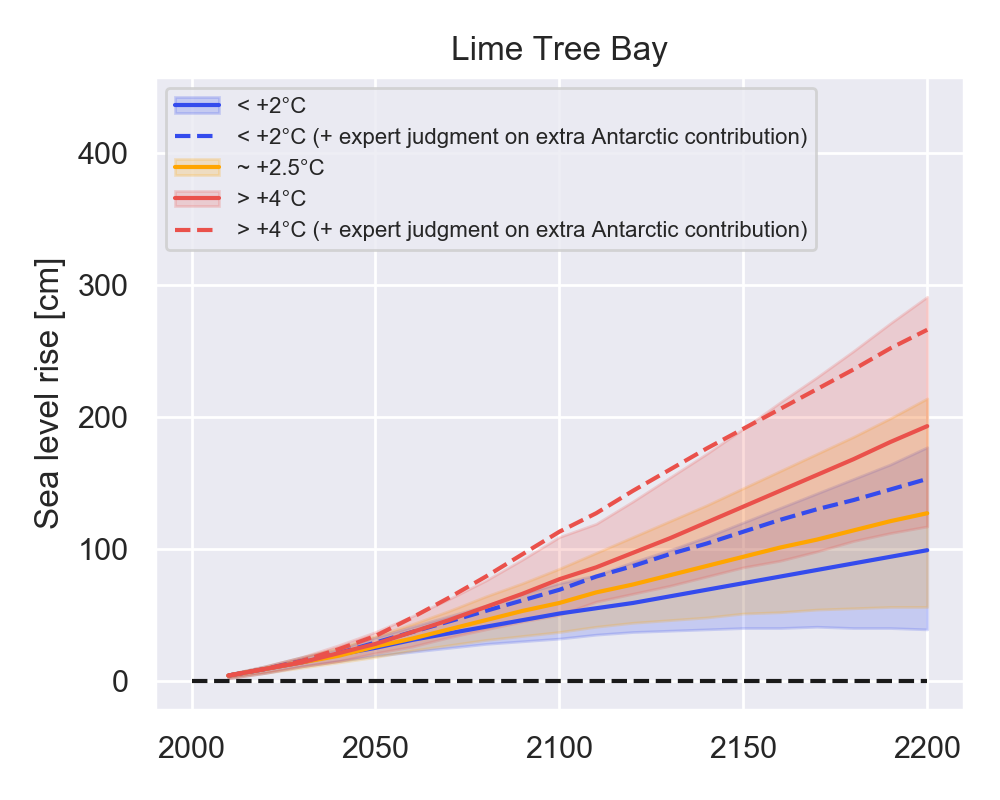
Figure: Local sea-level projections at Lime Tree Bay for different global warming trajectories. The solid lines represent multi-model medians, the shaded areas capture the 66% uncertainty range. Dashed lines show median sea-level projections including revised Antarctic ice-sheet contributions from Bamber et al. (2019).
Local Sea Level Rise [cm] |
||||
|---|---|---|---|---|
| year | median | uncertainty ranges | ||
| 66% | 90% | |||
| 2030 |
14 [15]
14
14 [15]
|
11-18 [11-19]
10-18
11-18 [11-21]
|
8-21 [7-23]
8-21
8-21 [8-25]
|
|
| 2050 |
25 [29]
26
28 [34]
|
19-33 [20-39]
18-34
21-37 [24-48]
|
15-39 [14-50]
13-41
16-45 [18-63]
|
|
| 2100 |
51 [69]
59
77 [113]
|
32-74 [46-100]
37-85
50-109 [74-176]
|
21-100 [31-133]
23-111
32-141 [51-256]
|
|
| 2150 |
74 [113]
94
132 [191]
|
40-120 [70-171]
51-146
86-191 [125-312]
|
22-173 [41-229]
26-202
59-253 [86-601]
|
|
| 2200 |
99 [153]
127
193 [266]
|
39-177 [92-241]
56-214
117-291 [174-436]
|
10-276 [52-332]
18-313
77-402 [119-963]
|
|
Table: Local sea-level projections at Lime Tree Bay for global warming trajectories shown in Figure above. The second column shows the multi-model median, column three shows the 66% uncertainty range, and column four shows the 90% uncertainty range. Shown in brackets are sea-level projections including revised Antarctic ice-sheet contributions from Bamber et al. (2019).
Contributions to local sea-level rise
The contributing components modelled by Kopp et al. (2014) are:
Antarctic and Greenland ice sheets based on IPCC AR5 and expert elicitation, glacier and ice caps based on an improvement of the IPCC AR5 method, oceanic processes including thermal expansion and dynamic effects taken from CMIP5 simulations, land water storage taking into account changes in population, and all non-climatic contributions combined into background effects.
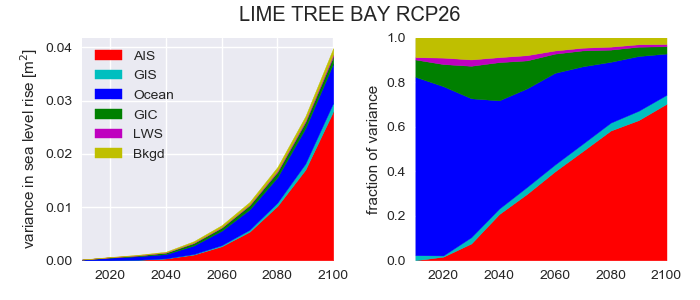
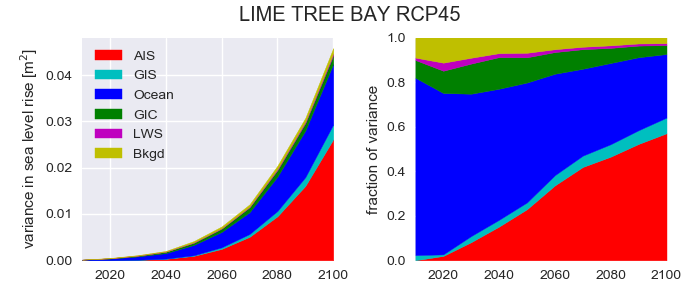
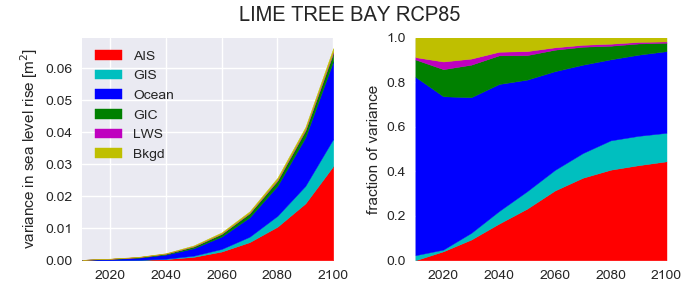
Sources of variance in local sea-level projections for all contributing components in absolute terms (left) and as fraction of total variance (right). AIS: Antarctic ice sheet, GIS: Greenland ice sheet, Ocean: oceanographic processes, GIC: glaciers and ice caps, LWS: land water storage, Bkgd: local background effects.
